The Challenge
An aerospace manufacturer was relying on EOState Exposure OT, an Optical Tomography system that uses a high-resolution near-infrared camera, to monitor melting and exposure on their EOS M290 machine. This system provided detailed thermal maps for each layer of the metal additive manufacturing process, flagging anomalies such as hot spots or irregular exposures.
While useful, the OT system posed a critical limitation: it couldn’t quantify the severity or impact of anomalies. Engineers could see where thermal irregularities were happening, but they didn’t have the data to understand whether these would actually affect part quality. This uncertainty made it difficult to make decisions mid-build, identify root causes, or confidently intervene in the production process.
The Solution
To close the gap, the customer installed Phase3D’s Fringe Inspection™ system on the same EOS M290 machine. Fringe Inspection™ provides high-resolution, layer-by-layer geometric measurements of the powder bed using structured light. Unlike indirect monitoring, Fringe Inspection™ delivers unit-based, metrology-grade heightmaps of each layer.
The Phase3D team worked with the customer to:
- Register Fringe Inspection™ data and OT exposure maps into a common coordinate space and synchronize layer indexes.
- Use Fringe Operator™, Phase3D’s data visualization software, to ingest and overlay both thermal (OT) and geometric (Fringe Inspection™) data streams.
- Create a multi-modal, real-time view of build health across thermal and geometric domains.
Key Findings
The integration of Fringe Inspection™ with OT revealed powerful insights and unlocked new capabilities:

Figure 1: Fringe Operator(TM) User Interface, showing the 3D Build Display (left) and 2D Heightmap View (right)
· Multimodal Anomaly Detection
o Fringe Inspection™ captured high-resolution heightmaps of each layer to detect powder bed anomalies.
o EOState OT provided real-time exposure maps highlighting hot spots and underexposed or overexposed areas.
o Combined, the data streams offered a comprehensive picture – linking thermal and geometric changes across each layer.

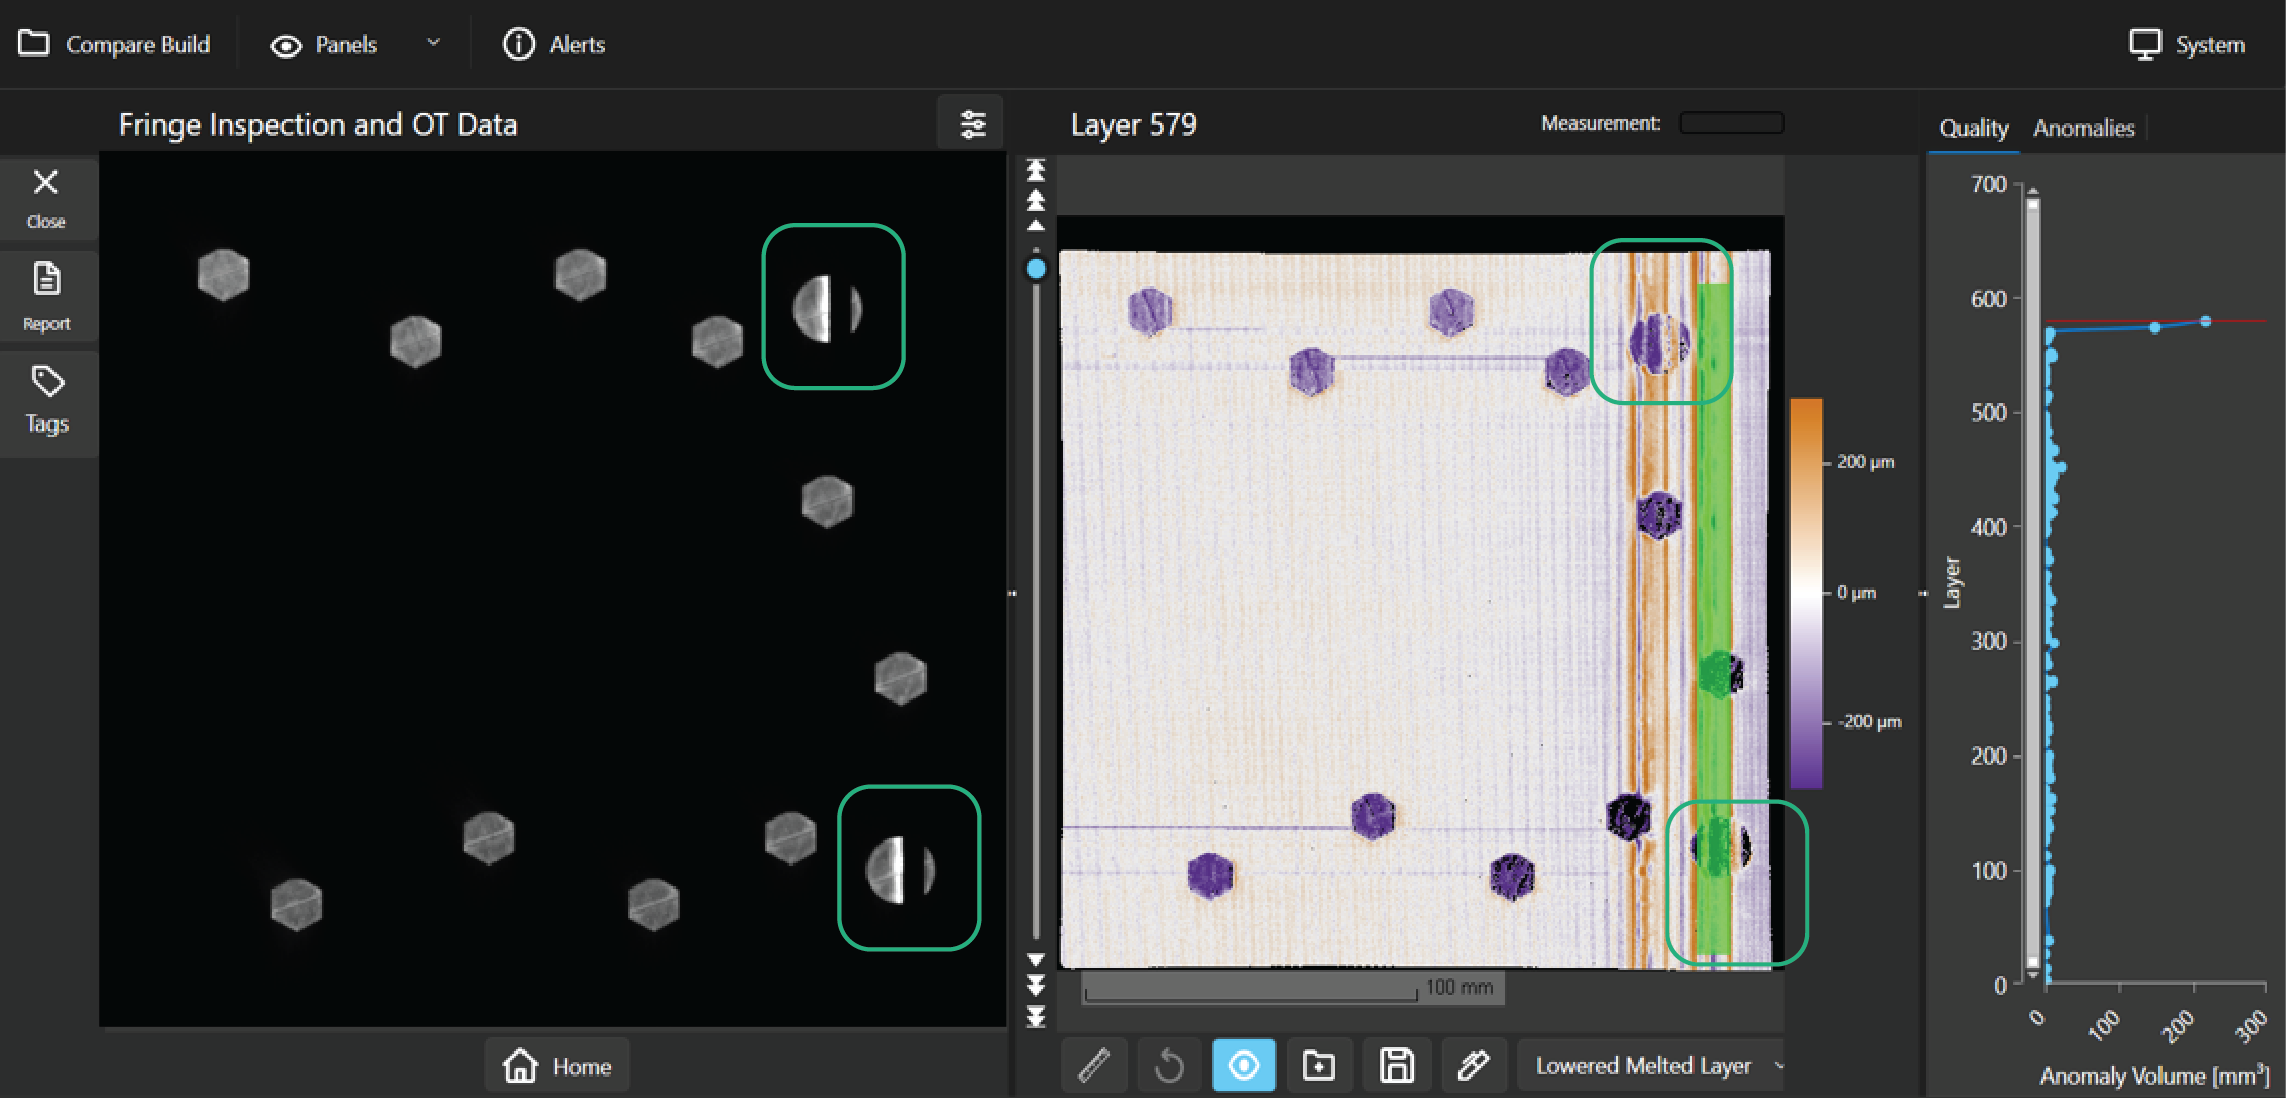
Figure 2: Fringe Operator(TM) User Interface, showing the 3D Build Display (left) and OT Data Set (right)
· Validation of Anomalies
o OT data alone flagged thermal irregularities in powder bed/melted regions but couldn’t indicate if they were critical.
o Overlaying OT and Fringe Inspection™ data allowed engineers to see the true impact, as they can quantify part swelling.

Figure 3: Fringe Operator(TM) User Interface, showing the OT Data Set (left) and 2D Heightmap View (right)
· Improved Root-Cause Analysis
o With both data types synchronized, engineers could more easily trace surface defects back to their root cause – whether due to thermal or exposure-related issues, such as part swelling, or stemming from powder bed anomalies like recoater streaks, hops, or short feeds. The combination of data streams also helped clarify the causes of certain powder bed anomalies, such as identifying overheating as the trigger for part swelling that led to recoater contact.
o By correlating OT exposure maps with Fringe Inspection’s geometric data, engineers could quantify specific outcomes like surface depressions from underexposure or elevations caused by overexposure.
Conclusion
By integrating Phase3D’s Fringe Inspection™ with EOState Exposure OT, the aerospace manufacturer transformed their in-situ inspection to a multi-modal decision-making tool. This new capability allowed them to:
- Validate and prioritize anomalies with measurable data.
- Understand the thermal and geometric evolution of each build layer.
- Conduct more precise root-cause analysis when issues occurred.
- Gain confidence in adjusting builds in real-time to prevent defects.
The combination of thermal and geometric monitoring proved essential for aerospace-grade part quality. It offered the clarity and traceability required to reduce scrap, cut inspection costs, and maintain tight process control in a high-stakes environment.
Next Steps
Phase3D and the customer are now exploring:
- Correlation with CT scans to link in-situ anomalies with internal porosity.
- Automated go/no-go criteria using both data streams to flag builds with high defect likelihood.
Share: