
Laser powder bed fusion (LPBF) is used to manufacture production components across aerospace, defense, energy, medical, and other high-value industries. As manufacturers move from successful individual builds to higher production volumes, the quality challenge changes. Adding machines, increasing build rates, or expanding across sites creates more layers and more process data to review, while engineers still need to understand when and where a deviation occurred.

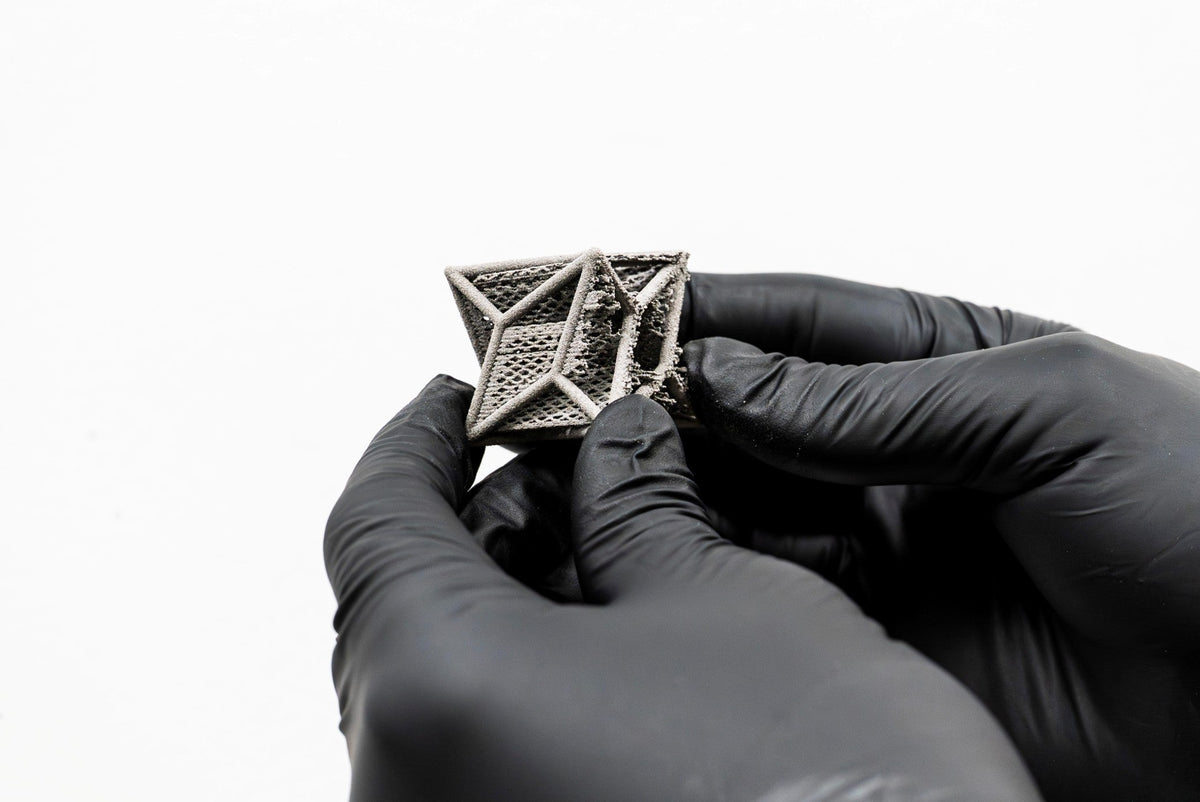
Figure 1. A metal additively manufactured lattice part with visible defects along its fine features. As production scales, quality teams need to identify and assess such deviations consistently across builds.
Post-build inspection evaluates the finished component. In-process measurements add a record of how the build developed, including surface changes that may be difficult to reconstruct afterward. For a production team, the question is whether monitoring data can help them locate and characterize a change, assess its progression, and compare it across layers, builds, and machines.

In situ monitoring for additive manufacturing
There is no single form of additive manufacturing process monitoring. Current systems can observe thermal behavior, melt pool characteristics, optical emissions, machine telemetry, recoating, powder bed appearance, and the physical surface of the build. Each provides different information, and the presence of a monitoring system alone says relatively little about what can actually be determined from its data.
For manufacturers evaluating in situ monitoring for additive manufacturing, the more useful questions are what is being observed or measured, at what resolution, and what information engineers can extract from the resulting dataset.

Table 1. Comparison of common LPBF process monitoring approaches and the quantitative surface measurement capabilities of Phase3D Fringe Inspection™.
What a heightmap adds to a powder bed image
Conventional imaging can provide a visual record of the build surface based on contrasted greyscales and reveal features that may warrant further investigation. However, an image does not inherently provide a dimensional measurement of those features.
If an anomaly is visible on the powder bed, an engineer may want to determine its height, size and location. They may also need to determine whether it remains stable, grows, or appears elsewhere on subsequent layers. Those questions require measured surface data that can be compared consistently.
Phase3D Fringe Inspection uses structured light to produce a heightmap of the build surface, reporting local height relative to a defined reference. When the same region is marked in both views, the heightmap can turn a visible feature into a measurement with a location, size, and height or depth.
For a suspected protrusion or recoating disturbance, engineers can record its layer, X–Y coordinates, measured extent, and change in subsequent layers. Those values support a repeatable comparison that an unannotated image cannot provide.

Figure 2. Layer 502 shown as a powder-bed image (A), an unmasked heightmap (B), and a software-detected region (C). The heightmap retains a vertical scale in µm. The callout in C reports the height and area measured for the detected region; the overlay shows which part of the underlying height data was evaluated.
Following an anomaly across layers
Scaling LPBF production increases the number of layers an engineering team must review. A single unusual image may attract attention, but its importance is easier to judge when the team can see whether the affected region persists or changes as the build continues.
A short-feed condition can appear as a local change in powder-bed surface height. Heightmaps help quantify how far the affected region extends and how its depth changes on later layers. That layer-specific record gives technicians information to review alongside recoater activity and material-feed data. When a monitoring workflow includes suitable alert criteria, a developing trend can prompt a check during the build and inform powder-dosing efforts.
In the example shown, affected area increased from 57.5 to 135.9 mm² between layers 652 and 672, while reported maximum depth increased from 80 to 260 µm. If the build takes roughly a minute per layer, that change could unfold in about 20 minutes. Actual time depends on the build and scan strategy, but the layer-to-layer progression is the important point: the measurements show how quickly the surface condition changed and provide a record technicians can investigate.

Figure 3.Short-feed development between layers 652 and 672. Unmasked heightmaps (top) show the surface data; detection views (bottom) highlight the affected regions in orange. Over 20 layers, reported affected area increased from 57.5 to 135.9 mm² and maximum depth from 80 to 260 µm.
The heightmaps do not, by themselves, establish the cause of the short feed or determine the final disposition of a part. They identify the measured surface response and its progression, which can be checked against material-feed, recoater, and machine records. At production scale, that helps teams focus their review on specific events and layers instead of searching through an entire build image by image.
Using the measurements across production builds
A larger build history is useful only if engineers can find an event, inspect its measured region, and compare it with other layers or builds. A practical review starts at a build-level event list, opens the relevant layer and heightmap, and preserves the measurement and location alongside the build record.
Measurements also make an investigation more specific. Rather than treating every visible feature as the same type of anomaly, a team can compare its location, area, height or depth, and progression. A change that appears on one layer and disappears may call for a different review than one that expands across successive layers. Consistent measurements help production teams make those comparisons as build volumes grow.
A measured surface change can have several possible contributors, including powder or material condition, process parameters, recoater or machine behavior, and part geometry or setup. The fishbone diagram provides a guide to records worth checking. Its branches represent possible contributors; they are not inputs directly measured by the heightmap or causes proven by the surface data.

Figure 4. Possible contributors to a measured surface change. The fishbone branches identify material, process, machine, and setup records to investigate. A separate callout states what the heightmap actually measures: height or depth, affected area, X–Y location, and progression across layers.
Engineers can test those possibilities against powder and recoater records, machine parameters, and the build setup. Surface measurement belongs beside those records and beside post-build results. It can document an in-process event and support an investigation, while CT, dimensional inspection, and mechanical testing answer different questions about the finished component. Any link between a measured surface event and a downstream finding should be established with matched build and part evidence.
Production takeaway
Scaling metal AM quality review requires more than collecting additional images or adding a monitoring system to every machine. Engineers need data they can use to locate an event, measure it consistently, follow it across layers, and compare it with the rest of the production record. Quantitative surface measurements provide that layer-by-layer context. Combined with machine information and post-build inspection, they help quality teams review a growing number of builds without losing the detail needed to investigate individual events.
Where does scaling make quality review harder for your team?
Which quality questions are becoming harder to answer as your production scales? We’d welcome a conversation about where Fringe Inspection could add useful measurement evidence. Email sales@phase-3d.com.
➤ Learn more about Fringe Inspection
➤ Learn more about Fringe Technology
Frequently Asked Questions
What are the main challenges of scaling metal additive manufacturing?
Scaling metal additive manufacturing requires more than increasing machine capacity. Manufacturers also need to maintain process consistency, manage larger volumes of production and quality data, increase inspection throughput, and maintain traceability across builds and machines. As production grows, quality assurance and process monitoring need to scale alongside it.
What is in situ monitoring for additive manufacturing?
In situ monitoring for additive manufacturing is the collection of process information while a part is being manufactured. In LPBF, monitoring technologies can capture information about the melt pool, thermal behavior, powder bed, recoating process, machine conditions, and build surface. Different monitoring technologies measure different aspects of the process, so the type and quality of data produced can vary significantly.
Why is in situ monitoring important for metal additive manufacturing?
In situ monitoring gives engineers information about events that occur during the build rather than relying solely on post-build inspection. This can help identify when and where process anomalies occurred, support root-cause investigations, and provide additional process data for quality assurance and process development.
What is additive manufacturing quality software?
Additive manufacturing quality software is used to analyze, manage, and interpret data generated during AM production and inspection. Depending on the system, this can include identifying process anomalies, reviewing individual layers, comparing builds, analyzing measurements, and maintaining traceable records of manufacturing data. Phase3D's Fringe Inspection™ software is designed to analyze quantitative surface measurement data captured during LPBF builds.
What is the difference between LPBF process monitoring and post-build inspection?
LPBF process monitoring collects information while the build is taking place, while post-build inspection evaluates the component after manufacturing. The two provide different types of information and can be used together. In situ monitoring can provide a record of events during manufacturing, while methods such as CT, dimensional inspection, and mechanical testing provide information about the resulting component.
How does Phase3D monitor the LPBF process?
Phase3D's Fringe Inspection™ uses structured light to measure the surface of the powder bed throughout an LPBF build. It produces quantitative height data, allowing surface features and anomalies to be measured, located, and tracked layer by layer rather than relying on image-based observation alone.

Share: